Topic / Energy / In-depth
Clean Energy U-Curve

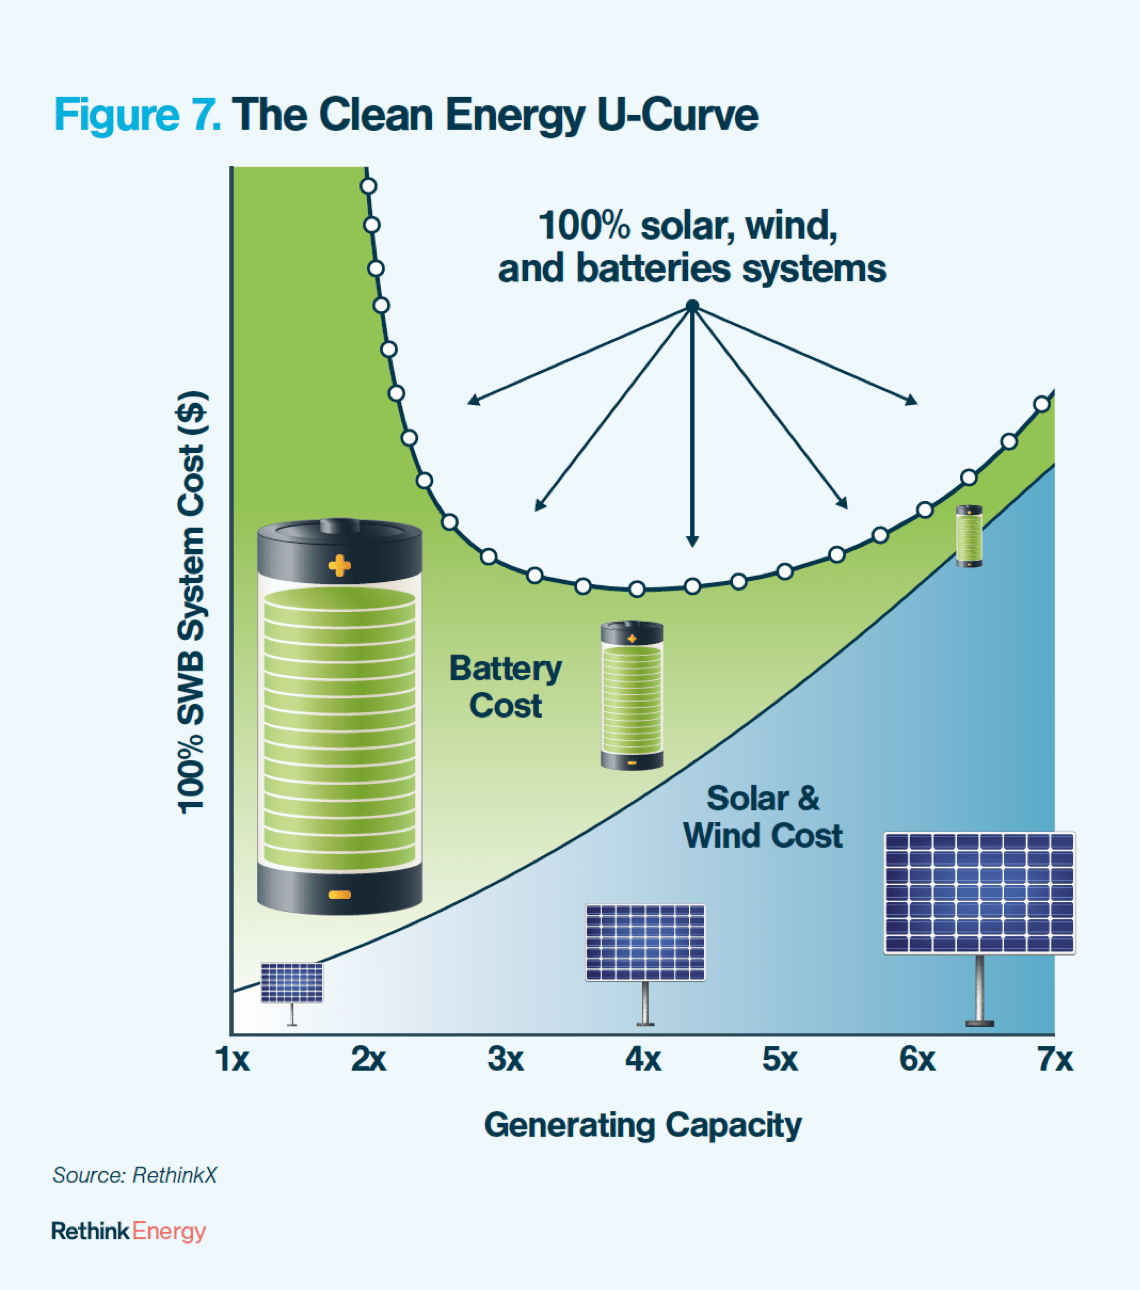
RethinkX's ‘Clean Energy U-Curve’ is a tool that shows how thousands of combinations of solar, wind and batteries (SWB) can deliver 100% of our electricity demand
We use this tool to understand the lowest cost combination of solar, wind and batteries
Overbuilding SWB energy capacity reduces battery storage requirements, and provides superabundant electricity year round.
The Clean Energy U-Curve reveals that for all regions, overbuilding generating capacity several times that of existing demand reduces battery storage requirements.
Therefore, overbuilding a solar, wind and battery system reduces overall costs, while also allowing the system to get through the darkest days of winter.

Designing an SWB system to get through the darkest days of winter creates a surplus of energy.
We call this superabundant, zero-cost energy SWB Superpower.
Access to superabundant, zero-cost energy will transform our societies and industries in unimaginable ways.

Key features of the Clean Energy U-Curve
100% SWB systems create extraordinary energy surplus
The Clean Energy U-Curve shows that additional investments in SWB result in large increases in generating capacity.
This enables a huge surplus in electricity generation produced at zero marginal costs for most of the year.
The need to meet energy demand on cloudy days creates this surplus
All SWB systems produce a surplus of electricity because they must be built to meet demand during the times when sunshine and wind are least available.
This is why 100% SWB systems produce a superabundance of clean energy.
Surplus leads to superabundant SWB Superpower. SWB Superpower is the future.
The surplus of electricity from solar and wind power is clean and overall has near-zero marginal cost. RethinkX refers to this as SWB Superpower.
This superabundant energy will revolutionize our lives and societies, how we live, organize and create our world.
A surplus of clean energy at near-zero marginal cost available at all times of the year will transform our systems, and allow us to address some of the greatest challenges we face.
The Clean Energy U-Curve provides a solution to high cost SWB challenges
-
Long stretches of cloudy winter days when available sunshine is at its minimum present the greatest challenge to SWB systems.
-
This challenge can be solved with a combination of generating capacity and storage capacity.
Large generating + modest storage capacity
On the one hand, a 100% SWB system could meet demand on a cloudy day by having a very large amount of solar and wind generating capacity paired with a comparatively modest battery energy storage capacity.
Solar and wind could then still meet demand during the day, even with meager winter sunshine, while at the same time charge the batteries so that electricity could continue to be supplied throughout the night.
Modest generating + large storage capacity
On the other hand, a 100% SWB system could instead meet demand by having a comparatively small amount of solar PV and wind generating capacity paired with an extremely large and expensive battery capable of storing weeks’ worth of average hourly electricity demand.
The battery could be charged in advance during sunnier and windier periods, and then drawn upon during times of overcast winter weather.
Both of these solutions are too expensive.
To keep costs low, a balanced trade-off between SWB generation and storage capacity must be struck
We call this trade-off the Clean Energy U-Curve
To minimize overall system costs, or capital expenditure of an SWB system, an optimal balance between the generation and storage capacity of a system must be identified.
This capital cost tradeoff relationship is characterized by a U-shaped curve, which forms what we call our 'Clean Energy U-Curve.'

An SWB system optimized for cost using this curve will have three to five times more generating capacity than today’s grid
As a result, any 100% SWB system will produce an extremely large amount of surplus electricity at near-zero marginal cost.
Very importantly, this tradeoff relationship is not linear.

The shape of the Clean Energy U-Curve differs between regions because of sunshine and wind availability
Moreover, the Clean Energy U-Curve is not perfectly symmetrical, but instead tends to be skewed toward greater generation capacity.
Matters are further complicated by the fact that the costs of SWB are all declining at different rates.

Policymakers, investors and the public still underestimate the potential of trading off generation and storage capacity to identify cost-effective SWB options

When the costs of an SWB system are optimized correctly according to the Clean Energy U-Curve, it becomes clear that 100% SWB systems are not only achievable but are in fact the cheapest available option for new power generation on a timeframe to 2030 – and in many cases will be less expensive than continuing to operate existing conventional power plants as well.

Clean Energy U-Curve & SWB Superpower
As adoption of SWB grows, these technologies will produce an increasingly large surplus of energy at near-zero marginal cost. We call this Clean Energy Super Power – or 'SWB Superpower' for short.
This is because the system’s capacities must be designed to fully meet electricity demand during the most challenging times of year- such as the cloudy weeks of winter when the days are shortest. As a result, they are able to produce much more power throughout the rest of the year.

100% SWB systems will produce a surprisingly large amount of Superpower—in sunny areas more than twice total electricity demand.
The resulting superabundance of clean energy will open the door to new possibilities for society, the economy and the environment.
-min-2.png?width=1200&name=Copy%20of%20Website%20imagery%20-%20Featured%20Image%201200x628%20(1)-min-2.png)
SWB Superpower will be plentiful enough to displace a large portion of other energy use outside of the electricity sector alone, such as in water desalination and filtration, road transportation, heating, waste management, and industrial and chemical processes. There will be a reduction in greenhouse gas emissions as fossil fuels in these applications are displaced.

Watch Director of Research Adam Dorr describe the Clean Energy U-Curve:
Once you understand the Clean Energy U-Curve, you can understand how we make predictions at RethinkX
You can also understand why the disruptions of energy, transportation and food & agriculture will be so transformational
%20Copy-min.png?width=717&name=Report_Hero_Rethinking-Energy-LCOE%20(1)%20Copy-min.png)
Featured Report
Learn more about the Clean Energy U-Curve
Download our Rethinking Energy report


.png?width=732&name=Copy%20of%20Website%20imagery%20-%20Featured%20Image%201200x628%20(9).png)
.png?width=732&name=Website%20imagery%20-%20Featured%20Image%201200x628%20(3).png)


